|
An optical strip chart recorder for
classroom applications
Andrew Davidhazy Images for Science and Education Most people are familiar
with strip chart recorders. We see them used for medical purposes as
well as law enforcement applications. They are used in seismographs and
in a related way in oscilloscopes. These instruments accept some kind
of signal and then display the signal level as a line on a piece of
paper or a line on a CRT screen such as a scope.
The underlying usefulness of strip chart recorders is that they provide a permanent record of input signal fluctuations as a function of time. Strip chart recorders in some cases are fairly expensive devices. I am going to suggest here that fundamental concepts of acquiring data, analyzing it and arriving at quantitative answers to questions related to subject performance can be obtained with something as simple as medium quality digital cameras. Of course the cost of these cameras is something to consider but the premise is that one already has one of these cameras used strictly for pictorial photography applications. The following description and applications will demonstrate how to transform the plain digital SLR camera into a tool of measurement similar to the strip chart recorder. What are the two functions that the recorder performs? One is to deflect a pen or needle across the width of a piece of paper. The other is that it moves the paper at a known rate and this gives the deflections of the marks on the paper a "time base". The faster the paper moves the better the time resolution of the instrument. This means that events that take a very short time can be tracked and quantified because the changes in level drawn by the pen are display over longer lengths of paper. Sophisticated digital cameras are manufactured that contain within them a single array of photosensors. These are known as linear array cameras. The length os the linear array represents the upper and lower limits within which an optical image can be detected and tracked by the sensor. The sensor is sampled at regular intervals and the resulting data is displayed as an image varying in height or location along the array and displayed over time as the array is sampled over and over again and each line is added to the previous one causing the gathered information to appear to move across a computer screen. To simulate what takes place in a chart recorder or a linear array camera one needs, first of all, to limit the standard DSLR camera sensor's acceptance angle to a narrow vertical strip or line. This can generally not be done easily within the camera itself. And even if it could be done it would not serve much of a purpose. 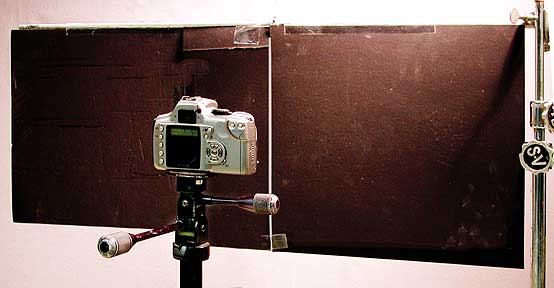 To prevent flare or ghosting of the resulting photographs the back of these masks needs to be as dark as possible. In addition, the subject should be lit by lamps located on the other side of the slot from where the camera is located. Room lights on the camera side should be extinguished and spill light to the back of the masks should be minimized. Results will guide you I am sure. Then, by rotating the camera, that slot and the the view beyond that slot, are made to move across the width of the sensor by the simple action of "panning" the camera from one side to the other. As you do this and if you look through the viewfinder you will see that the line moves from one side to the other. The faster the camera is turned or panned the faster the slot moves across the frame. The faster it moves the better the time resolution. Much the same as with a chart recorder. Now what about the subject itself? It can be just anything that you want to measure. Rate of change, rotation rate, duration, or velocity and acceleration, simultaneity, etc. Unlike the input to a chart recorder, im most cases a voltage change, the input in this case will be the optical image of the event under study. If, as the camera is being turned, the shutter of the camera is held open then changes in the subject as seen through the slot will be recorded onto the camera's sensor while the image of the slot moves from on side of the viewfinder to the other. But, there is a small problem with rotating the camera and viewing through the slot. Objects beyond the slot will appear to move indicating that the location at the subject side of the slot changes depending on the orientation of the camera. This can be overcome as explained below. 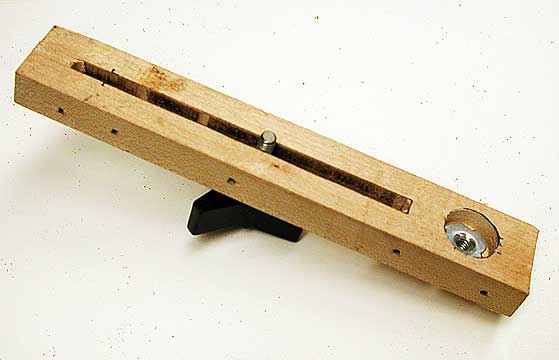
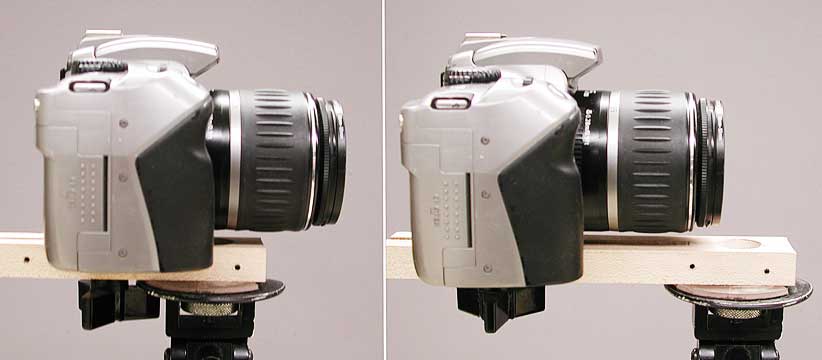
Then attach the camera to the bar using the first hole away from the tripod mounting hole. Or locate the camera close to the tripod axis if using a slotted bar. As you look trough the viewfinder now sight a thin object located on the other side of the slot. A pencil stuck in some clay so it is vertical is a good subject. The pencil should be seen bisecting the slot with the camera pointed in such a manner that the slot appears in the middle of the viewfinder. Now rotate the camera to the left and right noting the position of the pencil within the slot. If the image of the pencil appears to move across the slot then change the position of the camera so it is now rotated about an axis even further away from the tripod's rotation axis. At some point you will find that the pen seems to remain lined up with the slot whether the camera is aimed to the left, middle or right of it. You are now rotating the camera about a "magicaL" point or axis associated with lenses where rotation about that axis keeps the spatial relationship between foreground and background ojects fixed. 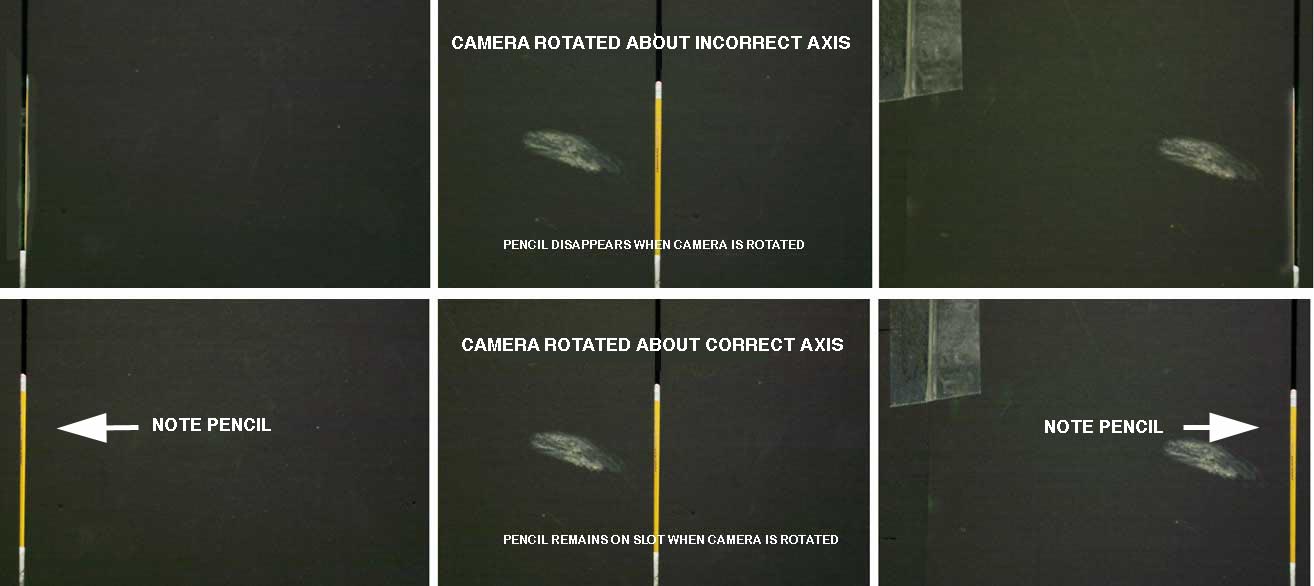 The next level of sophistication is the inclusion in the slot of a "time base" generator. This can be something as sophisticated and expensive as a stroboscope or a fan rotating at some known speed and interrupting a light beam in a periodic (but known) time interval. Now that we have set-up a basic optical chart recorder let us apply the system for measuring and characterizing a couple of events. In every case, in order to make quantitative determinations, we will include a time base provided by a rotating disk with a slot cut in it turning at a known rate. The rotation rate of the "mechanical" stroboscope is determined by photographing it at a known exposure time set on the camera. A more expensive solution could have been used, such as using a flashing light calibrated stroboscope but we will keep things simple for at least a couple of these experiments. 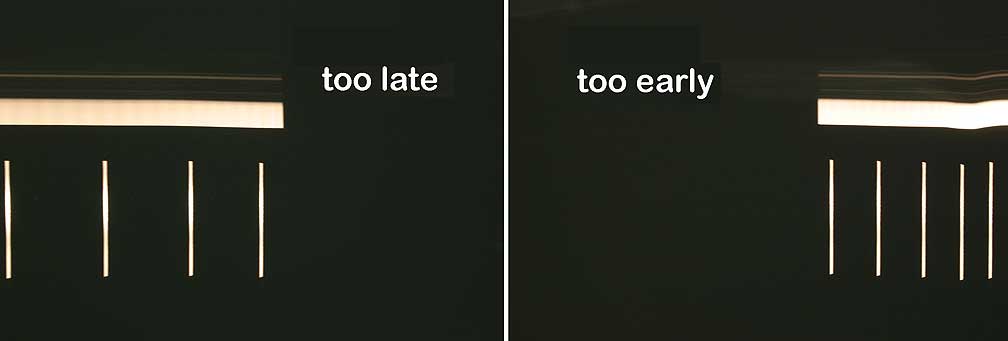
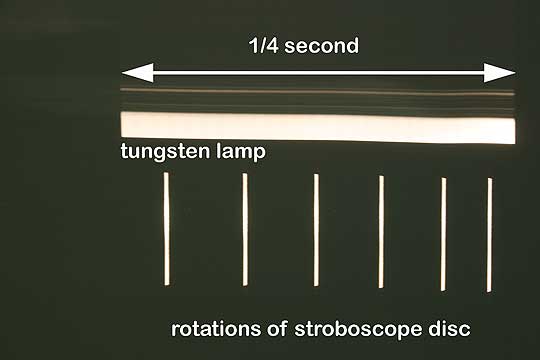 To calibrate our timing
mechanical stroboscope we place the rotating disc, driven by a motor
powered by a 9 volt battery, just behind the slot in the black mask and
set our camera exposure time to some value less then the time it will
take us to pan the camera while recording the slot's image as it moves
from one side of the frame to the other. In this case 1/4 second was
chosen. After several trials (usually) it should be possible to record
a series of marks across the image with both ends of a mark left by a
lamp purposefully left turned on during the process. The "streak left
by this lamp must not extend beyond the edges of the frame otherwise we
will not be able to determine where the exposure time starts or
ends. The illustration at the right indicates that during the 1/4
second exposure time the disc made 6 turns. Therefore the time between
marks is 1/24 (or 1/25) second. When we include this information in
other photographs we will be able to make a measurement of elapsed time
in 1/25th second increments.
For the first experiment we will visualize and determine the duration of a flash of light from a flashbulb. Granted that flashbulbs are hard to find but we happened to have a few. These are light bulbs that burn brilliantly but only for a short time. 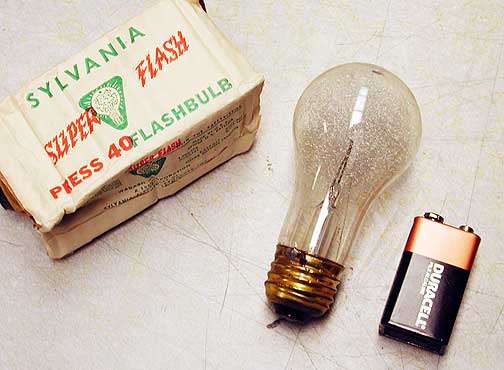
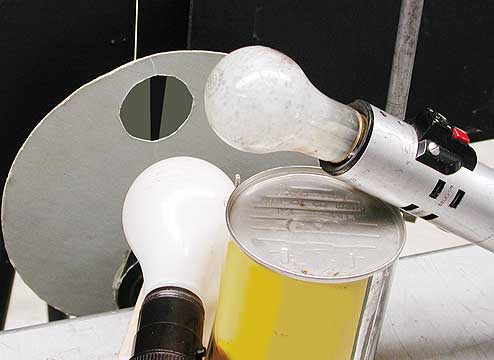 The system was set-up as shown in the illustration. The light from the light bulb behind the rotating disc was periodically allowed to pass on to the camera as the disc rotated. This was to give the time base. The flashbulb was installed in a holder and located above the tungsten lamp. As in previous situations the room lights were extinguished and as the camera shutter was opened for about 2 seconds and the camera swung from side to side, the flashbulb was set-off and produced a brilliant flash of light that was "spread out" by the streak system as a light trace. 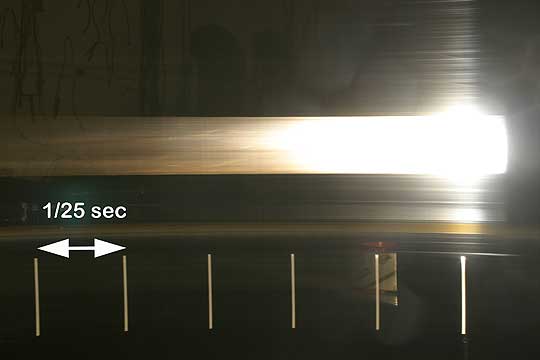 From the record obtained it is a fairly simple matter to arrive at insights about the performance and duration of the light blast. In addition it is easy to see that the camera was turned at a pretty steady rate as indicated by the fact that the spacing of the timing marks is quite uniform. Anyway, from this record it is obvious that the lamp achieves peak brilliance in a very short time. Knowing that the time between timing marks is 1/25 th second one could estimate the the bulb reaches peak brightness in about 1/4 of the distance between marks or about 1/100 second. It then stays at maximum output for maybe another 1/100 second and after that it steadily declines in output and has almost completely turned off in 5/25 th of a second or about 1/5 th second. We might also infer that possibly the useful life of the burst is about 1/50th to 1/25 th second. This is a LOT better than we could do by trying to estimate the flashbulb's behavior by simply looking at it! 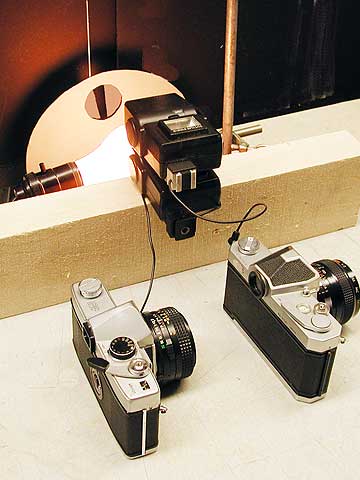 For the
second project we will determine the ability of a person to respond
to an event or signal. To look into this we will ask a person to fire
the shutter of a camera that itself will fire a short duration
electronic flash. Then we will ask another person to trip the shutter
of a second camera giving that person instructions to do this as soon
as they see the flash of light from the first flash. The objective is
to determine approximately how long of a delay is introduced into
the sequential firing of the flashes by human reaction time. If there
were no delay then the two flashes should occur simultaneously. For the
second project we will determine the ability of a person to respond
to an event or signal. To look into this we will ask a person to fire
the shutter of a camera that itself will fire a short duration
electronic flash. Then we will ask another person to trip the shutter
of a second camera giving that person instructions to do this as soon
as they see the flash of light from the first flash. The objective is
to determine approximately how long of a delay is introduced into
the sequential firing of the flashes by human reaction time. If there
were no delay then the two flashes should occur simultaneously. Again, the streak camera, located on the other side of the black masks and aimed to the side of the slot through which a view of the periodically interrupted light from a tungsten bulb is seen. The camera also records the passage of the images of the two flashes, one set atop the other, as they are wiped across the camera's sensor. Because the tungsten bulb illuminates the reflectors of the flashes these these will leave a continuous streak across the frame but these marks are really of no consequence. To perform this test, then, the camera shutter is opened for a brief time, maybe 2 seconds or so, and as it pans across the open slot the first camera and flash is fired and then the second one. The first flash is placed in this case atop the second one. In between the firing of the first and second flash the camera is able to move the image of the slot a certain distance. This distance effectively is the time that elapses between the firing of the 2 flashes. The results shown below are the results of two tests and they speak eloquently of the reaction time of 2 test subjects. 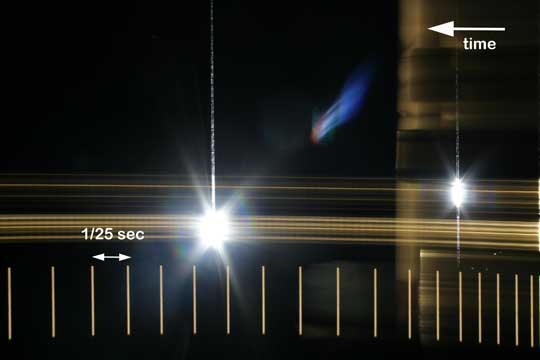
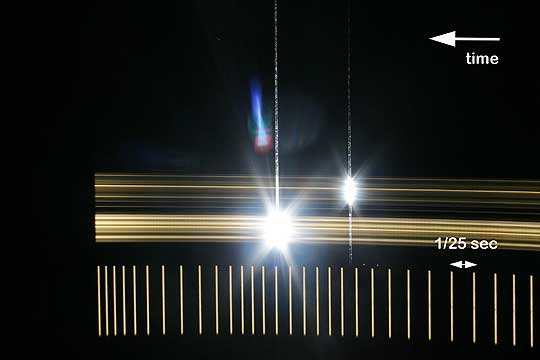 In the picture at left one can count about 7 vertical bars between the image of the "trigger" flash and the "response" flash indicating that about 7/25 ths of a second 1/3.75 second elapsed from the time the person saw the first flash until they activated the second one. In the photograph on the right once can appreciate the fact that the camera was rotated more slowly and the camera shutter closed too early but neither factor really matters as we are only after the number of light interruptions between the two flash discharges. This is about 5 marks between the two flashes or about 1/5th second. This indicates that the second person had a slightly better reaction time than the first. Now is that not an interesting fact? 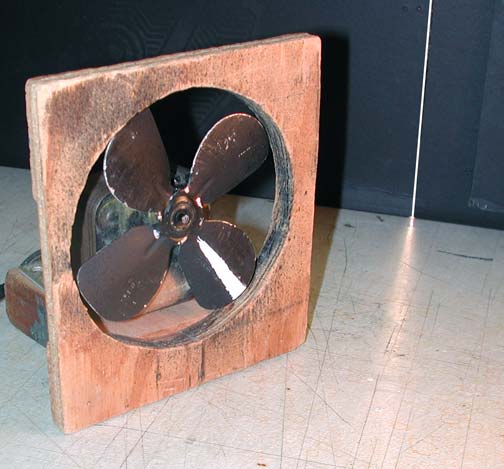 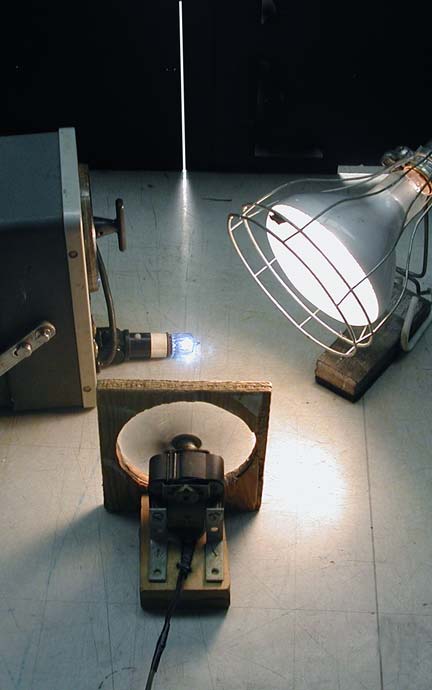 Finally we will do something a little more demanding and this is to determine the rotation rate of a fan. For this project we switch to a different timing device. A flashing light stroboscope. The one we used was a General Radio 1531A Strobotac stroboscope. This instrument produced accurately calibrated frequency of 100 flashes of light per second or 1/100 second between flashes. Note that the rotating disk stroboscope could have been used in this instance as well but to achieve the flashing rate easily reached by the flashing light stroboscope, 4 slots would have had to be cut into the mechanical stroboscope's disc unless it could be rotated 4 times faster which was not achievable. To achieve good time resolution the streak camera needed to be turned quite rapidly and so it was a matter. again, of making sure the shutter was opened before the image of the slot entered the field of view of the camera and that it remained open for the duration of its traverse across the frame. Further it should not remain open so long that the camera would eventually start to pick up extraneous subjects located in its environment. The system was set-up as shown in the illustration above. One blade of the fan was marked with a white line. It would be "visible" to the camera as it moved from left to right at the top of its rotation and from right to left at the bottom, 180 degrees beyond its top location. 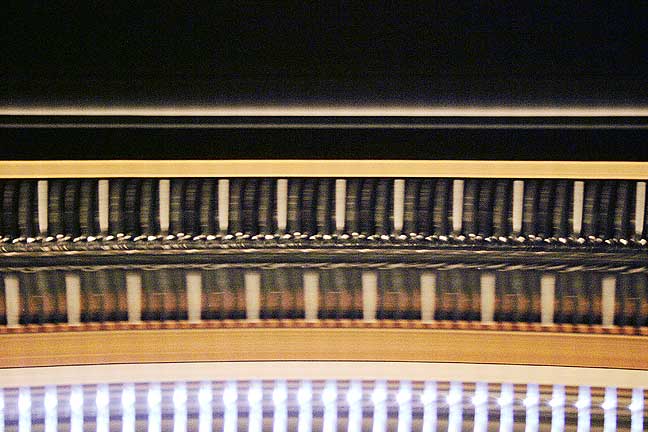 The result of this project is illustrated in the photograph above. Note that the spacing of the timing marks provided by the stroboscope avery 1/100 second are distributed quite uniformly across the bottom of the record. This is due to the fact that in this instance the camera was rotated by a motorized tripod head although, again, rotating by hand would have bee possible. In any case, from the record is is easy to determine that it took the camera about 25/100 seconds or 1/4 second to wipe the image of the slot across the image plane of the camera. In that time the fan made about 11 360 degree revolutions or it was turning at about 44 RPS or 2640 RPM. And this is just the beginning for a myriad of visualization and timing problems that can be solved by streak cameras. Even simplified versions of these cameras, such as described in this article, can provide useful, informative and quantitative data. If a subject were to vibrate in front of the sot then rate of vibration could be easily determined. If there is a mixing process going on in front of the streak camera system's slot then a visual record of the process can be made and quantitatively described. The order of arrival to a destination by several objects can be determined as they pass sequentially past the open slot of the streak "system". Ingenuity and imagination are they key to putting this powerful timing system to use! I will be the first to admit that this system does have some limitations but the idea is not to dwell on those but rather delight in the problem solving ability of an improvised timing system. One that many consider out of reach. If you found this
article and examples of interest and want to communicate with me feel
free to write to me at:
Andrew Davidhazy, andpph@davidhazy.org |